Today is 2nd January and the days are getting longer again. I was thinking about sunrise and sunset times and wondering if I should do some data analysis and plotting of these to visualize how they change over the course of a year. Of course, the first step is to get a suitable data set.
You can get a data set of sunrise and sunset times from this page on the US Naval Observatory (USNO) website. Sunrise and sunset times depend on your specific location on the globe so you have to specify the location for your data set. Using the “Form B” Locations Worldwide" section on the page it is possible to enter precise coordinates for any location in terms of latitude and longitude. You can also do it for a timezone, but this is very broad and not precise enough for my liking.
Getting your coordinates
You can get your exact coordinates from the website of the National Geospatial-Intelligence Agency (NGA). You could also do the same on OpenStreetMap, by right-clicking on a location and choosing “show address” (or on Google Maps), but the NGA system gives more precise information about the type of coordinate system used. FYI, OpenStreetMap gives the coordinate that corresponds to “Latitude North” and “Longitude East”. But if your Longitude East value is negative, this just corresponds to the Longitude West value if you make it positive. However, the NGA form wants the coordinates in minutes and seconds, not a decimal fraction of minutes, so if you don’t want to convert units I recommend using the NGA site.
Downloading the sunset and sunrise data
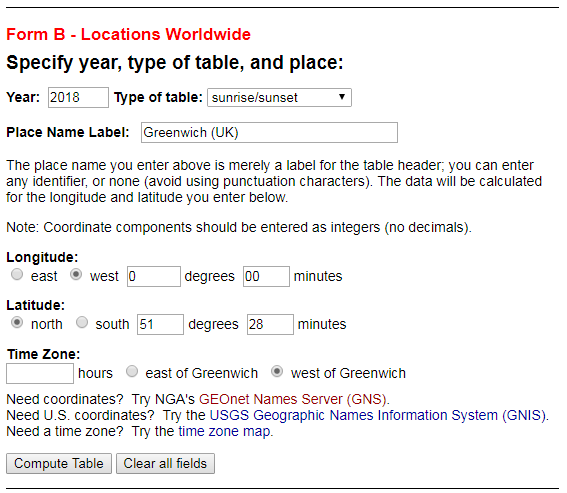
Once you know the coordinates, you can enter them into the USNO page and click “Compute table” for any year that you specified in the “year” field. Here are the settings I used to get the data for Greenwich, London:
 These are the settings I used in the USNO “Complete Sun and Moon Data for One Day&” form to get data for Greenwich, UK.
You should now see a text based data table with columns for sunrise and sunset for each month for that year, with a row for each day in the month. Go ahead and save as a text file on your local drive and then you can use Pandas or whatever to wrangle the data into whatever format you want. I will make a further post at a later date with some suggestions. Bye for now and good luck!
 This is the USNO sunrise data file for Greenwich, UK.
