As an R&D engineer, working within one of the largest wafer fabs in Europe, I spend a lot of my time analyzing data and generating reports, in order to make informed decisions about product design and process. It’s essential to use tools that can help analyze data quickly and easily, so I can identify trends and problems and take corrective action.
Two popular data analysis tools for engineers like myself are SAS JMP and Microsoft Power BI. Both tools have their own strengths and weaknesses, so it’s important to choose the right tool for your needs.
SAS JMP
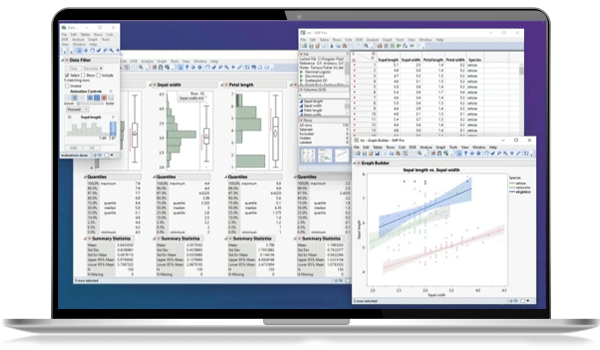
SAS JMP is a more technical tool that is designed for data scientists and statisticians. It has a wide range of features, including advanced statistical analysis capabilities, as well as features for design of experiments and quality control. SAS JMP is also a more powerful tool than Power BI, and it can handle larger datasets. I like using JMP to model the main input parameters affecting a key performance metric, since the user interface allows quick analysis and some useful plots, such as a pareto for the main factors and their statistical significance.
However, SAS JMP is generally quite complex and it has a steep learning curve. If you are not a data scientist or statistician, you may find JMP difficult to use.
Power BI
Microsoft Power BI is a more user-friendly tool that is designed for business users and analysts. It is easier to learn and use than SAS JMP, even for users with no prior experience with data analysis tools. Power BI also has powerful options to integrate reports into Powerpoint, which is a ubiquitous tool for sharing information on most companies.
However, Power BI does not have as many advanced statistical analysis capabilities as SAS JMP. It is also not as powerful as SAS JMP, and it may not be able to handle large datasets.
I really like the fact that Power BI can import, filter and modify data from a wide range of sources and different formats using a Power Query pipeline. It can then create relations between these data, just like in a relational database (RDB) system and displays the relations visually.
Although JMP can also join and merge data together, I find the way it does this to be extremely clunky and usually results in projects that are difficult to manage. The Power BI approach is IMHO much more elegant.

Plotting Capabilities
SAS JMP and Power BI both have powerful plotting capabilities, but they have different strengths and weaknesses.
SAS JMP has a wider range of plotting capabilities than Power BI, including:
- 3D plots: SAS JMP can create 3D plots, which can be helpful for visualizing complex data relationships. Power BI does not support 3D plotting.
- Animated plots: SAS JMP can create animated plots, which can be helpful for showing how data changes over time. Power BI does not support animated plotting.
- Statistical plots: SAS JMP has a wide range of statistical plotting capabilities, including plots for histograms, boxplots, and scatterplots. Power BI has a more limited range of statistical plotting capabilities.
- Custom plots: SAS JMP allows users to create custom plots using the JSL programming language. Power BI does not allow users to create custom plots.
However, Power BI also has some plotting capabilities that SAS JMP does not have, including:
- Web-based plotting: Power BI plots can be published to the web, which makes them easy to share with others. SAS JMP plots can only be published to a local file and can be integrated into Powerpoint, where they can remain interactive.
- Mobile plotting: Power BI plots can be viewed on mobile devices, which makes them accessible to a wider audience. SAS JMP plots can only be viewed on desktop computers.
Ultimately, the best tool for plotting will depend on your specific needs and requirements. If you need a tool with a wide range of plotting capabilities, then SAS JMP is a good choice. If you need a tool that is easy to share and view on mobile devices, then Power BI is a good choice.
Here is a table summarizing the default plotting capabilities of SAS JMP and Power BI:
| Feature | SAS JMP | Power BI |
|---|---|---|
| 3D plots | Yes | No |
| Animated plots | Yes | No |
| Statistical plots | Yes | Limited |
| Custom plots | Yes | No |
| Web-based plotting | No | Yes |
| Mobile plotting | No | Yes |
Conclusion
Both SAS JMP and Power BI are powerful data analysis tools that can help you improve your engineering output and decision making. The best tool for you will depend on your specific needs and requirements. If you are not sure which tool is right for you, I recommend trying both SAS JMP and Power BI and seeing which one has the capabilities that you require. Or better still, add both of these fantastic tools to your arsenal!