Business intelligence tools like Power BI and Looker Studio (formerly known as Google Data Studio) help companies visualize and analyze data to gain valuable insights. But which platform should you choose for your organization? Here we compare the pros and cons of Microsoft Power BI and Looker Studio.

Overview of Power BI
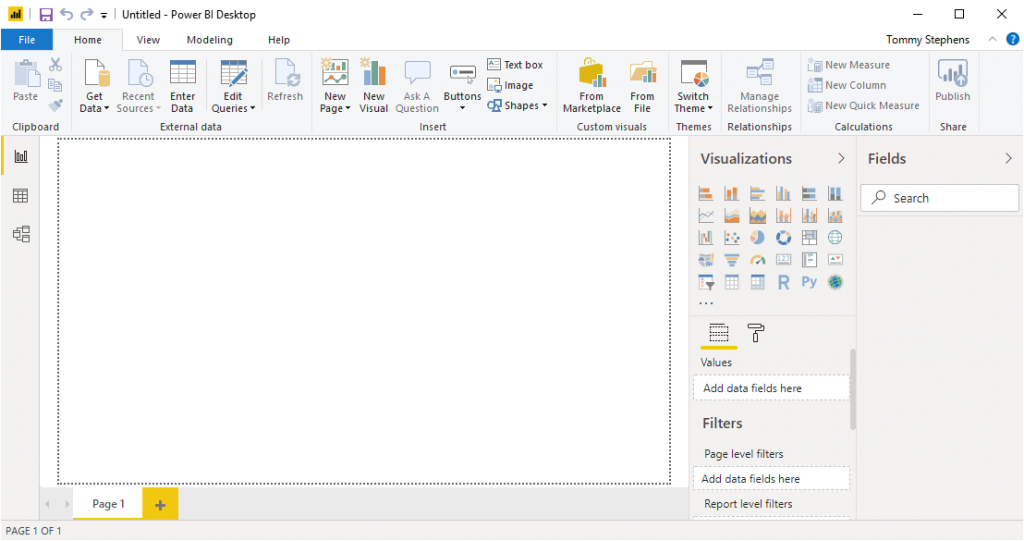
Power BI is a business analytics service developed by Microsoft. It connects to various data sources, applies intelligence to transform and model data, and creates interactive reports and dashboards. Some key features include:
- Drag-and-drop interface to visualize data quickly
- Options for charts, maps, pivots tables, natural language queries
- AI-powered visual recommendations and forecasting
- Publish reports to the cloud or embed into apps
- Collaboration tools to share and discuss insights
- Connect to data sources like Excel, SQL Server, Salesforce
Power BI offers a desktop app for authoring reports which can then be published online. There are also mobile apps to view reports on the go. Power BI integrates tightly with other Microsoft products.
Overview of Looker Studio (formerly Google Data Studio)
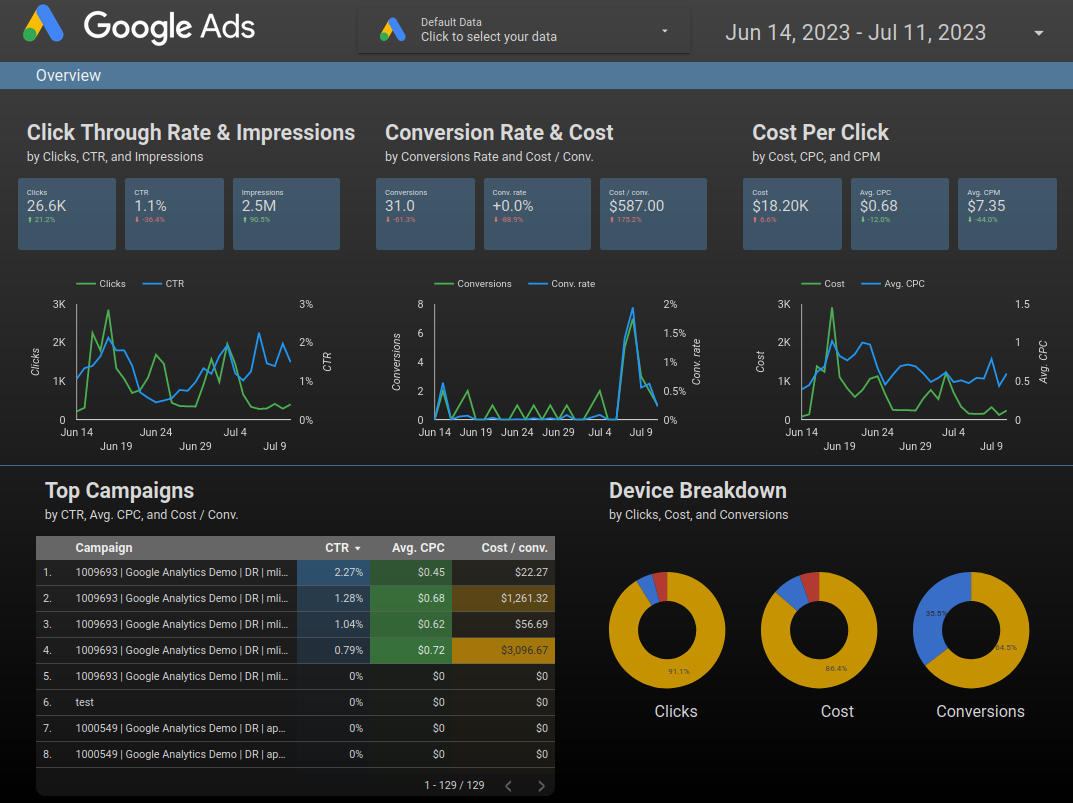
Looker Studio allows you to build business intelligence dashboards using data from multiple sources including Google Sheets, BigQuery, MySQL, Postgres, Salesforce and more. Key features include:
- Intuitive drag and drop report editor interface
- Numerous customizable chart types and formatting options
- Interactive filtering and exploration of data
- Ability to embed live reports into web pages or export to PDF
- Connected Sheets integration for easy data updates
- Share reports and collaborate with teammates
- Available for free with core functionality
Looker Studio is fully web-based so there is no software to install. You can access it anywhere through a browser. It can be used standalone but also integrates with Google Analytics and Google Ads.
Data Connectivity
Power BI has connectors for a vast array of data sources from Excel, SQL databases, Facebook, MailChimp, Google Analytics, and hundreds more. It can handle large datasets and real-time streaming data.
Looker Studio connects to Google products like Sheets, BigQuery, and Google Ads along with various third-party apps via connectors. It can work with large data volumes through integrations like BigQuery.
Ease of Use
Both tools offer drag and drop interfaces for building reports without coding. Power BI has a more desktop-inspired experience with its downloadable app. Looker Studio runs fully in the cloud.
Power BI includes AI visual recommendations to easily highlight patterns. Looker Studio provides templates to simplify report creation.
Overall, both tools are user-friendly for creating visualizations without programming expertise.
Visualization Capabilities
Power BI offers a wide array of visualization types from basic charts to more advanced visuals like tree maps, funnel charts, gauges and more. Custom visuals can also be added from Microsoft’s marketplace.
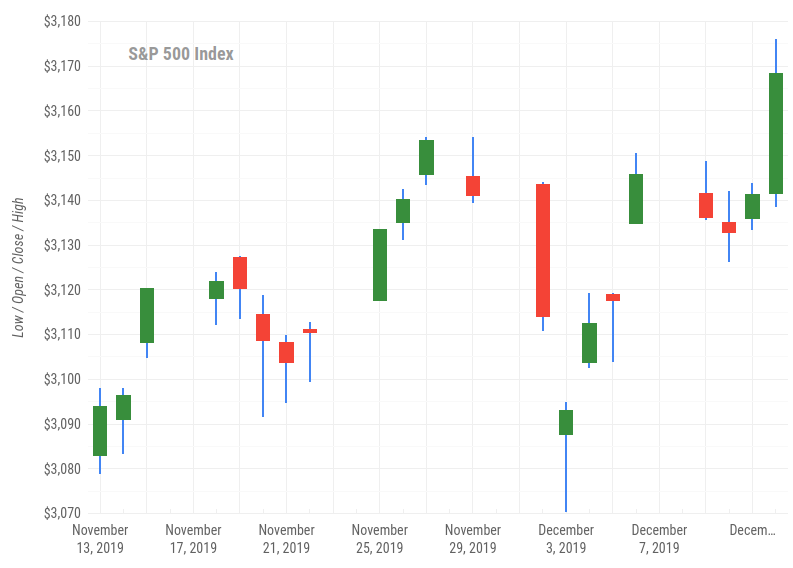
Looker Studio provides the core standard chart types along with scorecards, pivots, geographic maps, and date-based formats like candlestick charts. The style and color scheme is more standardized compared to Power BI.
Power BI likely has the edge in advanced visualization flexibility although both meet typical business needs.
Sharing and Collaboration
Power BI makes it easy to share reports and dashboards with others in your organization. There are also content packs with pre-built reports that can be taken and customized.
Looker Studio allows reports to be shared internally with teammates for collaboration. There is no content marketplace, but public Data Studio reports can be copied as a starting point.
Power BI includes more built-in collaboration capabilities for enterprise-wide sharing.
Pricing and Licensing
Power BI’s desktop authoring app is free. Creating and sharing content online requires a Power BI Pro license which is $9.99 per user monthly.
Looker Studio is entirely free for users who only need core functionality based on Google-owned cloud products. However, more complex reports may need connections to paid services like BigQuery and external SEO.
Platform editions, where an organisation hosts their own instance of Looker Studio, can become expensive.
For larger organizations, Power BI Pro can become very costly while Looker Studio has no per user fees.
Conclusion
In summary, Power BI provides richer visualization capabilities and built-in collaboration for the enterprise. Looker Studio is easier for quick cloud reporting and more affordable, leveraging Google’s analytics ecosystem. Evaluate both tools to determine the right fit for your data analysis needs.